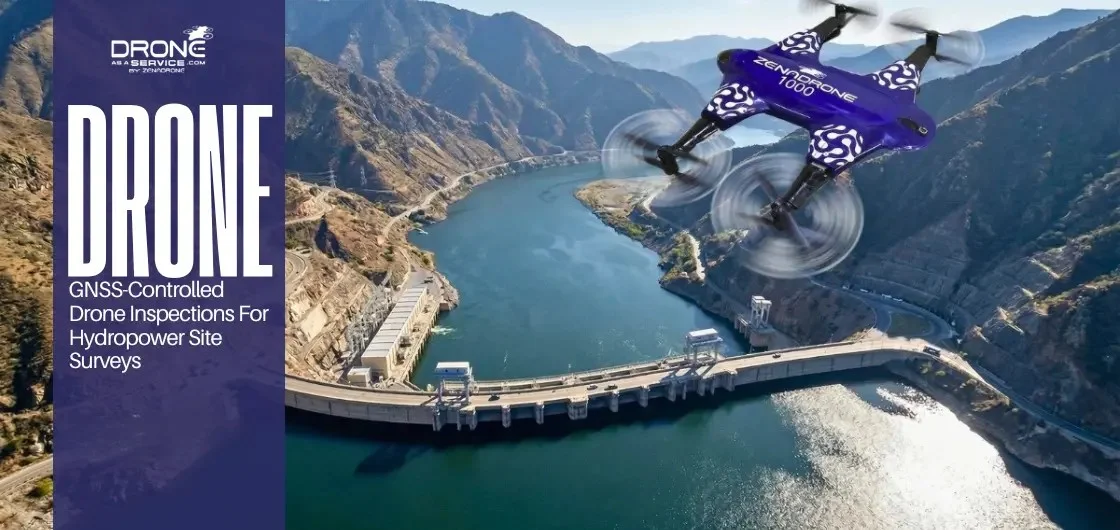
Hydropower Drone Inspection: RTK GNSS Survey Guide 2026
This guide covers everything site managers, civil engineers, and UAV operators need to know about drone-based hydropower facility inspections using RTK and PPK GNSS positioning, thermal seepage detection, 3D digital twins, and industry-standard data processing workflows.
Field Reality: Key Operational Points
1. How GNSS and RTK Technology Works for Hydropower Inspections
GNSS (Global Navigation Satellite System) is the umbrella term for all satellite constellations: GPS (United States), GLONASS (Russia), Galileo (Europe), and BeiDou (China). Every survey drone uses GNSS to determine its position. The challenge is accuracy.
Standalone GNSS delivers only 2–5 metres of accuracy. At a hydropower facility, this is far too imprecise. You cannot detect structural cracks, measure settlement, or calculate debris volumes at 2–5 metre precision.
The Multipath Problem in Hydropower Valleys
Hydropower sites sit in deep mountain valleys surrounded by steep rock faces. Satellite signals bounce off these hard surfaces and travel longer paths than direct signals, introducing systematic position errors. This is called multipath error. In narrow gorges, raw GNSS data is essentially unusable for engineering-grade work.
RTK: The Solution
RTK (Real-Time Kinematic) adds a fixed ground base station at a precisely surveyed point near the site. This base station:
- Calculates the difference between its known position and what the satellites report
- Continuously transmits that correction to the drone over a radio link
- The drone applies the correction in real time to every GPS fix
- Result: 1–3 cm positioning accuracy regardless of multipath interference
RTK vs PPK: What’s the Difference?
In scenarios where radio links are unreliable – common in deep gorge sites – PPK drone workflow provides an equivalent alternative.
✗ RTK Live Correction
Radio link between base station and drone. Corrections applied during flight. Pilot can verify FIXED status before landing.
Risk: Radio link drops in deep gorges = unusable data.
✓ PPK Backup Recording
Drone logs raw GNSS observations onboard. Corrections applied in software after landing. Accuracy identical to RTK.
Benefit: Automatic backup if RTK link fails mid-flight.
2026 Best Practice: Configure drone for RTK as primary. Enable PPK logging simultaneously as automatic backup. If the radio link drops, you still have full-accuracy data.
| Positioning Method | Typical Accuracy | Suitable for Hydropower? | Ideal Use Case |
|---|---|---|---|
| Standalone GNSS | 2–5 m | ✗ No | Consumer navigation only |
| GNSS + GCPs Only | 3–10 cm | ⚠ Limited | Small accessible sites with clear sky view |
| RTK (Real-Time Kinematic) | 1–3 cm | ✓ Recommended | Standard for dam face and spillway surveys |
| PPK (Post-Processed Kinematic) | 1–3 cm | ✓ Recommended | Deep gorge sites where radio link is unreliable |
2. The Six Critical Inspection Zones at Every Hydropower Facility
A hydropower plant is a system of interconnected civil, mechanical, and hydraulic assets spread across a large geographic footprint. Effective drone inspection requires treating each zone separately with its own sensor requirements, flight parameters, and defect targets.
Zone 1: Dam Face and Crest
Primary Defects to Detect: Surface cracks, spalling concrete, seepage staining, joint displacement, settlement.
A photogrammetry flight at 30–50 m standoff distance with 80–85% front-overlap and 70% side-overlap generates an orthomosaic at 1–2 cm per pixel. This resolution detects cracks as narrow as 3–5 mm. A second thermal pass at dawn or dusk reveals internal moisture movement and seepage paths invisible to standard cameras.
Using the same automated flight programme for each recurring inspection creates a consistent dataset. Engineers can compare structural condition across cycles and identify deterioration trends with measurable precision.
Zone 2: Spillway and Stilling Basin
Primary Defects: Cavitation damage (surface pitting from high-velocity flow), concrete apron erosion, displacement of energy dissipator blocks.
Drone inspection is especially valuable here for volumetric analysis. Differencing two DSM surveys from consecutive inspection cycles quantifies exactly how much concrete has eroded and at what rate. This transforms reactive maintenance into a scheduled, budget-controlled programme.
Zone 3: Penstock and Pressure Conduits
Focus: External inspection of visible corrosion, coating degradation, expansion joint condition, and support anchor integrity along exposed sections.
Thermal imaging detects temperature differentials at transition points between buried and surface-exposed sections — an early indicator of insulation failure or internal leakage before surface damage appears.
Zone 4: Intake Structure and Trash Screens
Debris accumulation reduces flow efficiency and turbine output. Drone surveys map sediment accumulation volumetrically in approach channels and around screen frames. Maintenance teams schedule cleaning based on actual measured volumes rather than fixed calendar intervals. This optimises plant availability and reduces unnecessary downtime.
Zone 5: Powerhouse Structure and Roof
Powerhouse buildings are conventional reinforced concrete structures, but their remote siting and proximity to high-voltage equipment make traditional access expensive and hazardous. Drone inspection identifies roofing membrane failures, blocked drainage outlets, expansion joint deterioration, and structural movement at the junction between powerhouse slab and dam abutment – a zone prone to differential settlement.
Zone 6: Tailrace Channel and Downstream Embankments
The tailrace is where discharged water exits after passing through turbines. Bank erosion, scour below the stilling basin floor, and sediment deposition affect long-term structural stability downstream. Repeated drone surveys at defined intervals (typically quarterly or post-flood) produce differenced DSMs that map erosion and deposition volumes with centimetre accuracy, replacing weeks of ground-based survey work with a single flight.
3. Recommended Drone Systems and Sensor Payloads
Hardware selection at a hydropower site must account for three factors that do not apply to standard aerial surveys: the need for RTK or PPK GNSS capability, multi-sensor payloads (RGB + thermal minimum), and physical operating environment (high altitude, extreme cold, high humidity near spillways, confined spaces).
DaaS ZenaTech: Specialized Hydropower Drone Services & Hardware
DaaS Zenatech operates integrated hydropower drone inspection services across North America and Europe, specializing in RTK-based surveys for critical water infrastructure. Our fleet includes purpose-built systems for alpine dam environments with cold-rated components, redundant GNSS, and multi-sensor payloads optimized for seepage detection and structural monitoring.
Standard Configuration:
All deliverables integrate with ArcGIS, QGIS, and AutoCAD Civil 3D. 100% US and EU regulatory compliant.
Hardware Comparison: DaaS Zenatech Deployment Options
| Platform | Flight Time | GNSS Mode | Hydropower Application |
|---|---|---|---|
| Standard RTK Multirotor | 55 min | RTK + PPK | Dam face, spillway, penstock, the all-round choice for most inspections. Proven in alpine conditions. |
| Heavy-Lift Platform | 59 min | RTK + GNSS | Dual-payload missions: LiDAR + thermal simultaneously on single flight. For large facility surveys. |
| Fixed-Wing VTOL | 90 min | RTK + PPK | Large reservoir basin mapping and wide catchment topographic surveys. No runway required (VTOL). |
| Tethered System | Unlimited | N/A (internal) | Gallery tunnels, confined drainage structures, enclosed penstock inspection. Persistent aerial observation. |
Sensor Payload Selection
| Sensor Type | Zenatech Integration | Detects | Primary Zones |
|---|---|---|---|
| High-Res RGB | 45 MP full-frame module | Surface cracks, spalling, erosion, staining | Dam face, spillway, powerhouse |
| Thermal Drone | Radiometric, calibrated module | Seepage, leakage, insulation failure, wet zones | Dam body, penstock, gallery structures |
| LiDAR Technology | Solid-state, real-time processing | Precise 3D geometry; penetrates light vegetation | Reservoir shoreline, embankments, dense slopes |
| Multispectral Drone | 5-band sensor (optional add-on) | Vegetation stress, embankment seepage indicators | Dam embankment slopes, downstream buffer zones |
4. Step-by-Step Inspection Workflow: Pre-Flight to Final Deliverable
A reliable hydropower drone inspection does not start at the launch pad. It starts weeks in advance. The most common cause of unusable data, mission aborts, and safety incidents is inadequate preparation, not equipment failure.
Regulatory Clearance and Facility Access Permit
Ensure the assigned pilot holds the required certification for the jurisdiction (FAA Remote Pilot Certificate under FAA Part 107 in the United States; A2 CofC or STS authorization under EASA in Europe; Transport Canada RPAS Advanced license in Canada). Apply for airspace authorization if the site falls within controlled airspace. Submit a Site-Specific Risk Assessment and Method Statement (SSRAMS) to the plant operator at least two weeks before the planned inspection date.
Key Point: Involve the plant safety officer during planning, not on the day.
Site Reconnaissance and Hazard Mapping
Review existing topographic data, satellite imagery, and plant layout drawings before arriving on site. Identify take-off and landing zones, overhead transmission lines, communication masts, and terrain elevation transitions. Obtain a Digital Elevation Model to plan terrain-following flights that maintain consistent AGL altitude across variable terrain.
Critical: Note all water discharge schedules and agree a communication protocol with the plant control room for the duration of the inspection.
Ground Control Point (GCP) Layout and Survey
Place 5–10 GCPs distributed evenly across the survey area, with markers at the perimeter and at least one in the centre. Measure each GCP with a survey-grade GNSS receiver and record coordinates in the project datum and projection. Document GCP locations with photographs.
Non-Negotiable: Use the same permanent benchmark as the base station reference point on every repeat inspection. This is essential for change detection accuracy.
Mission Planning and Flight Path Programming
Use mission planning software to programme automated flight paths. Set minimum image overlap at 80% front and 70% side for photogrammetry. For vertical dam faces, use façade or corridor mission mode to keep the camera perpendicular to the surface at constant standoff.
Programme separate missions for RGB photogrammetry, thermal, and any LiDAR passes rather than combining them in a single complex flight.
You may like to read also: How Drone Photogrammetry and LiDAR Work Together in 3D Scanning
Pre-Flight System Checks
Confirm RTK status shows FIXED (not FLOAT) before every takeoff. Verify camera settings: minimum 1/1000s shutter speed, correct ISO for lighting conditions, autofocus locked. Check battery temperature; minimum 15°C for reliable LiPo performance. Set return-to-home altitude at least 30 m above the highest obstacle.
Critical: Confirm the plant control room is aware you are commencing the flight and knows how to reach the pilot immediately.
Flight Execution and Real-Time Monitoring
Execute the automated mission. Monitor wind speed, battery level, RTK fix status, and incoming preview images throughout the flight. For multi-battery missions, confirm the mission resumes from the correct position after each battery swap, check image timestamps and GPS coordinates to verify no coverage gap.
Data Transfer and Field Quality Check
Transfer images to encrypted drives before leaving the site. Conduct a quick field review: check image sharpness on a sample of 20–30 images, verify GCP markers are visible in images, and confirm the PPK log file is present if RTK was the primary method.
If critical coverage gaps are identified at this stage, a re-flight on the same day is far more efficient than returning to site after demobilization.
5. Data Processing and Deliverables
Raw drone imagery is input material, not a deliverable. The engineering value is generated in the processing stage, where photogrammetry and GIS software transforms thousands of overlapping images into structured geospatial outputs that integrate with standard engineering workflows.
The standard photogrammetry processing chain available in industry-standard software follows: image alignment and feature matching → bundle adjustment → sparse point cloud → dense point cloud → 3D mesh reconstruction → orthomosaic generation → DSM/DTM export. For a medium-complexity dam inspection covering 500–800 images, full processing typically completes in 2–6 hours on modern workstation hardware.
| Deliverable | Description | Inspection Application | Export Format |
|---|---|---|---|
| Orthomosaic Maps | Geometrically corrected, georeferenced aerial image | Visual crack mapping, condition documentation, regulatory reports | GeoTIFF |
| 3D Digital Twin | Textured 3D mesh with real-world coordinates | Remote structural review, stakeholder presentations, BIM integration | OBJ, FBX |
| DSM / DTM | Elevation grid of surface features (DSM) or bare earth (DTM) | Settlement monitoring, slope stability, reservoir capacity | GeoTIFF, XYZ |
| Point Cloud | Dense 3D point dataset of all visible surfaces | Engineering cross-sections, structural measurement, CAD integration | LAS, LAZ |
| Volumetric Report | Calculated volumes of sediment, scour, erosion, or material change | Sediment clearance planning, erosion rate tracking, maintenance scheduling | PDF report + CSV |
| Thermal Anomaly Map | Overlaid thermal and RGB imagery with temperature zones | Seepage detection, penstock insulation faults, joint moisture ingress | GeoTIFF, PDF |
| Change Detection Report | Differenced DSMs comparing two survey epochs, colour-coded by magnitude | Structural movement tracking, long-term erosion and deposition mapping | GeoTIFF, PDF |
All geospatial deliverables are exported in formats that integrate natively with engineering software: GeoTIFF for raster outputs, LAS/LAZ for point clouds, and DXF or SHP for vector overlays. This allows direct import into AutoCAD Civil 3D, ArcGIS, and QGIS without format conversion steps that introduce additional opportunities for error.
6. Real-World Case Studies: Hydropower Drone Inspections in Practice
Drone-Based Dam Seepage Inspection in Alpine Conditions
Hydroelectric facilities located in mountainous environments often face inspection challenges related to difficult access, cold temperatures, and inconsistent GNSS signal conditions caused by steep terrain. Traditional rope-access inspections can require extensive safety planning, partial shutdowns, and long field deployment periods.
Drone Inspection Workflow
In this example workflow, an RTK-enabled multirotor drone equipped with RGB and radiometric thermal imaging sensors was used to inspect the downstream face of a concrete dam structure. The objective was to identify potential seepage areas, moisture anomalies, and surface deterioration while minimizing operational disruption.
- Cold Weather Operations:
Battery temperatures were managed prior to flight to improve performance and maintain stable flight times in sub-zero conditions. - GNSS Reliability:
RTK correction workflows and backup positioning methods were used to improve positional accuracy in terrain with potential satellite signal reflection issues. - Thermal Imaging:
Early-morning thermal capture helped improve visibility of temperature differentials potentially associated with moisture intrusion or seepage activity.
Potential Deliverables
Orthomosaic Mapping:
High-resolution aerial imagery can support detailed visual inspection of concrete surfaces, joints, cracks, and staining patterns.
Thermal Analysis:
Radiometric thermal datasets may help identify temperature variations associated with subsurface moisture or material inconsistencies.
3D Modeling:
Photogrammetry workflows can generate accurate surface models to support engineering review, maintenance planning, and change detection analysis.
Operational Benefits:
Drone inspections may reduce the need for extensive rope-access deployments, improve inspector safety, shorten field time, and provide repeatable digital records for long-term asset monitoring.
Technical Relevance:
This example highlights common drone inspection methodologies used in infrastructure assessment workflows, including RTK positioning, thermal imaging, photogrammetry, and remote inspection planning for difficult-access environments.
Drone-Based Spillway Erosion Monitoring and Predictive Maintenance
Hydroelectric spillways are exposed to continuous high-velocity water flow, which can contribute to surface wear, cavitation damage, and progressive concrete erosion over time. Traditional inspection methods often rely on scheduled maintenance intervals rather than measured structural change, making it difficult to prioritize repairs based on actual asset condition.
Drone Monitoring Workflow
In this example monitoring programme, RTK-enabled drone photogrammetry and repeatable survey workflows were used to document and compare spillway surface conditions over multiple inspection cycles. Consistent flight paths, control point placement, and image overlap settings helped support reliable change detection analysis between survey periods.
- Repeatable Data Capture:
Automated flight planning and standardized survey procedures enabled consistent data collection for long-term monitoring comparisons. - Surface Modeling:
Photogrammetry processing generated detailed Digital Surface Models (DSMs) and orthomosaics for engineering review and condition assessment. - Change Detection:
Comparing sequential DSM datasets helped identify areas of material loss, erosion progression, and surface deterioration trends over time.
Potential Engineering Applications
Volumetric Analysis:
Drone-derived surface models can support estimation of erosion patterns and volumetric surface changes in spillway structures and surrounding infrastructure.
Predictive Maintenance Planning:
Trend analysis from recurring surveys may help engineering teams prioritize maintenance schedules based on observed structural change instead of fixed calendar intervals alone.
Operational Efficiency:
Routine drone inspections can reduce the need for extended manual survey access, support safer data collection workflows, and provide repeatable digital records for asset management programmes.
Engineering Decision Support:
GIS-based mapping, DSM differencing, and geospatial analysis can assist infrastructure teams in identifying deterioration trends and evaluating long-term maintenance priorities.
Technical Relevance:
This example demonstrates how drone photogrammetry, repeatable survey design, and geospatial change detection workflows can support infrastructure inspection, erosion monitoring, and predictive maintenance planning in hydroelectric environments.
7. Traditional Inspection Methods vs Drone-Based Surveys
| Factor | Traditional Methods (Rope-Access, Scaffolding) | Drone (RTK GNSS) Inspection |
|---|---|---|
| Inspection Speed | Days to weeks depending on site size | Hours to 1–2 days for full facility |
| Worker Safety | High risk: rope access, scaffolding, confined spaces, falls at height | Reduced operational risk: pilots and engineers remain on ground |
| Data Resolution | Manual notes and spot photographs at accessible points | 1–2 cm/pixel orthoimagery; full 3D model of every surface |
| Positional Accuracy | Dependent on surveyor skill and instrument access; typically 5–30 cm | 1–3 cm with RTK; fully repeatable across inspections |
| Plant Downtime | Often required; scaffolding blocks operational access | Typically zero; generation continues throughout flight |
| Coverage Area | Limited to physically accessible points and angles | Entire facility including inaccessible angles and overhangs |
| Repeat Consistency | Varies by inspector and access conditions; difficult to standardize | Identical automated flight path on every inspection cycle |
| Change Detection | Difficult; inconsistent data makes direct comparison unreliable | Automatic differenced DSM models show exact change by location |
| Cost per Campaign | High labour, scaffolding hire, plant shutdown losses; $150K–$300K typical | Significantly lower after equipment amortisation; $25K–$60K typical |
8. Safety Protocols and Regulatory Compliance by Region
Hydropower facilities are classified as critical national infrastructure in most jurisdictions. Drone operations at these sites are subject to stricter oversight than standard commercial UAV work. Non-compliance carries legal consequences and, more importantly, safety risks to plant personnel and equipment.
| Region | Pilot Certification Required | Additional Site Requirements |
|---|---|---|
| USA | Pilot holds FAA Remote Pilot Certificate (Part 107) | Remote ID broadcast mandatory; LAANC authorisation if controlled airspace; BVLOS waiver for long-range missions |
| Europe (EASA) | A2 CofC or STS authorisation | UAS operator registration required; follow national authority-specific rules for critical infrastructure |
| Canada | TC RPAS Advanced Operations licence | NAV CANADA airspace authorisation; facility-level access permit from plant operator |
| UAE / Middle East | GCAA NOC + operator permit | Critical infrastructure sites require additional government security clearance |
| Ireland / UK | EASA A2 CofC (IE) / CAA GVC (UK) | Follow EASA UAS Regulation (EU) 2019/947 in Ireland; UK-PDRA-01 or OSC in UK for complex operations |
On-Site Safety Requirements
Beyond certification, every hydropower drone inspection requires:
- Site-Specific Risk Assessment and Method Statement (SSRAMS) approved by plant operator at least 14 days before inspection
- Designated exclusion zone around launch area (minimum 100m radius for multirotor operations)
- Confirmed communication protocol with plant control room and emergency stop procedure
- Documented go-ahead from plant safety officer confirming no planned discharge releases during inspection window
- On-site briefing for all plant personnel adjacent to flight zones
9. 10 Common Field Problems and Solutions
Problem 1: RTK Status Shows FLOAT Instead of FIXED at Launch
✗ Cause
Poor satellite geometry, base station too far from drone, or radio interference from nearby electrical switchgear.
✓ Fix
Relocate base station to higher position with better sky view. Move drone to area with less overhead obstruction. Check for radio frequency interference from plant equipment. Never launch with FLOAT status, position errors up to 0.5 m are possible.
Problem 2: Images Are Blurry Across Entire Flight
✗ Cause
Shutter speed too slow for drone’s forward speed (motion blur) or strong wind vibrating gimbal.
✓ Fix
Increase shutter speed to at least 1/1000s. Reduce flight speed in windy conditions. Verify gimbal dampers are intact before mission.
Problem 3: Large Gaps or Holes in Photogrammetry Point Cloud
✗ Cause
Insufficient image overlap at terrain transitions or on vertical surfaces.
✓ Fix
Increase front overlap to 85% and side overlap to 75%. Add cross-hatch flight pattern perpendicular to primary strip direction. Use façade mission mode rather than nadir for vertical dam faces.
Problem 4: GCP Accuracy Check Fails After Processing
✗ Cause
GCPs measured with incorrect datum or coordinate system. GCP markers not visible in enough images.
✓ Fix
Re-measure GCPs with calibrated survey-grade receiver. Verify datum and projection match project coordinate system in photogrammetry software. Ensure each GCP marker is captured in at least 9 images from different angles.
Problem 5: Battery Depletes Faster Than Expected Mid-Mission
✗ Cause
Cold altitude temperatures reducing LiPo pack capacity by 20–30%.
✓ Fix
Pre-warm all batteries to at least 15°C before flight. Reduce planned flight time per battery by 25% for every 10°C below 10°C ambient. Always carry two additional batteries beyond the flight plan minimum.
Problem 6: Thermal Images Show No Useful Anomalies on Dam Face
✗ Cause
Mission flown in direct midday sunlight which uniformly heats surface and eliminates internal temperature contrast.
✓ Fix
Reschedule thermal flights to dawn or 30–60 minutes after sunset when solar heating is absent and internal moisture differentials produce maximum thermal contrast.
Problem 7: RTK Radio Link Drops in Deep Gorge Sections
✗ Cause
Rock walls blocking radio link between base station and drone.
✓ Fix
Switch to PPK logging mode and confirm drone is recording raw GNSS observations. Apply post-flight PPK corrections in processing. Alternatively, use CORS (Continuously Operating Reference Station) network subscription where available near site.
Problem 8: 3D Model Shows “Doming” or Bowl-Shaped Distortion
✗ Cause
Pure nadir flight pattern over flat surfaces introduces systematic lens distortion that curves the terrain model.
✓ Fix
Add oblique image passes at 15–30° camera angle. Place GCPs at perimeter of survey area, not just centre. Use full camera calibration mode during processing.
Problem 9: Volume Calculations Differ Significantly Between Repeat Surveys
✗ Cause
Base station placed at different reference point on each survey, or coordinate system inconsistency between survey epochs.
✓ Fix
Establish permanent benchmark on site and always set up base station at exact same known point for every inspection. Document datum, projection, and GCP coordinates in Survey Control Record filed with every inspection report.
Problem 10: Plant Operator Refuses Access or Halts Mission Mid-Flight
✗ Cause
No pre-submitted SSRAMS, undisclosed operational requirement, or uncoordinated discharge schedule.
✓ Fix
Submit full risk assessment and flight plan to plant operator at least 14 days before planned date. Attend pre-inspection coordination meeting with plant safety officer. Agree stop-work signal with control room and brief all personnel on site before commencing.
10. Frequently Asked Questions
➕ How accurate is RTK drone mapping at a hydropower site?
RTK drone surveys at hydropower sites typically achieve 1–3 cm horizontal accuracy and 2–5 cm vertical accuracy under good satellite geometry conditions. This is precise enough to detect structural movement between inspection cycles, measure crack widths on dam faces, and calculate sediment volumes with engineering-grade reliability.
Accuracy depends on satellite geometry, GCP quality and distribution, flight altitude, and image overlap, all of which can be controlled through disciplined pre-mission planning. In challenging environments (deep gorges with multipath), accuracy may degrade to 3–5 cm but remains suitable for most engineering applications.
➕ Does the plant need to shut down during a drone inspection?
In most cases, no. Drone inspections are planned to keep the UAV clear of active discharge zones and high-voltage electrical infrastructure, allowing generation to continue throughout the survey.
The key coordination requirement is confirming the plant’s water release schedule with the control room before each flight so no unplanned releases occur while the drone is at low altitude near the spillway or intake structure. For some high-hazard dams, facility operators may voluntarily reduce generation flow as a safety precaution, but this is rare and negotiable.
➕ What is the difference between RTK and PPK for hydropower drone surveys?
RTK (Real-Time Kinematic): Applies GNSS position corrections during the flight via a live radio link between the ground base station and the drone. The pilot can verify accuracy before landing. This is the primary method for most inspections.
PPK (Post-Processed Kinematic): Records raw satellite observations onboard and applies corrections in software after the flight. Accuracy is equivalent to RTK but errors can only be identified after processing. At hydropower sites with deep gorge terrain where radio links drop out, PPK logging is an essential backup to RTK.
Best Practice: Configure drone for RTK as primary. Enable PPK logging simultaneously as automatic backup. If the radio link drops, you still have full-accuracy data.
➕ How often should a hydropower facility be inspected by drone?
Most national dam safety frameworks require at least one detailed technical inspection per year, with additional inspections after significant flood events or seismic activity.
The cost-effectiveness of drone surveys makes quarterly inspections feasible for high-hazard dams, allowing operators to track structural changes at much finer time intervals than traditional methods allow. Many operators now run annual full photogrammetry campaigns supplemented by quarterly thermal and visual overflights. The choice depends on dam classification, regulatory requirements, and asset risk profile.
➕ What software is used to process hydropower drone inspection data?
The most widely used photogrammetry platforms are:
- Pix4Dmapper – Industry standard for surveying and engineering applications
- Agisoft Metashape – Excellent for complex geometries and large point clouds
- DJI Terra – Integrated solution for DJI hardware
For LiDAR point cloud processing, LiDAR360 and LP360 are common choices. Final deliverables are typically exported to ArcGIS or QGIS for GIS analysis, and to AutoCAD Civil 3D for integration into structural engineering design files.
All outputs should be in open geospatial formats – GeoTIFF, LAS, SHP, DXF – to ensure compatibility across client software environments.
➕ Does drone inspection data require sign-off by a licensed surveyor?
This varies by jurisdiction and by how the deliverables are used. In most US states, geospatially referenced outputs used as the basis for engineering decisions in regulatory submissions must be reviewed and stamped by a licensed Professional Land Surveyor (PLS) or Professional Engineer (PE).
In practice, this means the drone operator collects and processes the data, and a licensed professional validates and certifies the final report. Always confirm the specific certification requirements with the relevant state or national regulatory body before committing to deliverable specifications in a client contract.
➕ How much does a hydropower drone inspection cost compared to traditional methods?
Drone-based hydropower inspections typically cost 60–80% less than traditional rope-access or scaffolding methods. A full dam face and spillway survey by drone usually ranges from $25,000 to $60,000, while equivalent rope-access inspections often cost $150,000–$300,000 due to labour, scaffolding hire, safety overheads, and potential plant shutdown losses.
➕ Can drones detect seepage and leakage in dam structures?
Yes. Drones equipped with radiometric thermal infrared sensors can detect seepage and internal moisture movement in concrete dams that is invisible to standard visual inspection. Subsurface moisture cools the surface relative to surrounding dry concrete, producing thermal contrast of 2–4°C that thermal cameras capture clearly.
For best results, thermal flights are scheduled at dawn or within 60 minutes of sunset when solar heating is absent and internal moisture differentials are at maximum contrast. In one documented inspection, thermal drone surveys identified nine distinct seepage zones that manual rope-access inspections had completely missed, directly guiding targeted grouting repairs.
➕ What weather conditions affect hydropower drone inspections?
Three weather factors most impact hydropower drone operations:
- Cold temperatures: LiPo battery capacity drops 20–30% below 0°C. Batteries must be pre-warmed to at least 15°C, and flight time per battery should be reduced by 25% for high-altitude or alpine sites.
- Wind: Sustained winds above 10–12 m/s cause gimbal vibration and motion blur in photogrammetry images. Flights should be paused if wind exceeds the aircraft’s rated tolerance.
- Sunlight conditions: Thermal inspections must avoid midday sun, which uniformly heats surfaces and eliminates internal temperature contrast. Overcast diffused light is ideal for RGB photogrammetry.
Rain, fog, and snow halt operations entirely. Pre-flight weather review and a same-day “go/no-go” decision are standard practice.
➕ What is a Ground Control Point (GCP) and why is it important?
A Ground Control Point (GCP) is a physical marker placed on the ground at a precisely surveyed location, with coordinates measured using a survey-grade GNSS receiver. GCPs serve as reference points that the photogrammetry software uses to anchor the drone imagery to real-world coordinates and validate the final accuracy of orthomosaics, DSMs, and 3D models.
For a hydropower inspection, 5–10 GCPs distributed across the survey area (not clustered) are recommended with markers at the perimeter and at least one in the centre. Each GCP must be visible in at least 9 drone images from different angles. Using the same permanent benchmark across repeat inspections is essential for accurate change detection between survey cycles.
11. Practical Use Cases: When to Deploy Drone Inspections
Use Case 1: Seepage and Moisture Detection
Scenario: Dam embankment showing subtle staining patterns. Is it internal seepage or surface runoff staining?
Drone Solution: RGB orthomosaic at 1–2 cm/pixel captures surface staining patterns. Thermal flight at dawn reveals subsurface moisture zones (cooler than surrounding dry concrete). Deliverable: Precise seepage zone map guides targeted grouting repairs.
Cost Comparison: Rope-access inspection: $45,000 + 2 weeks. Drone inspection: $18,000 + 1 day.
Use Case 2: Structural Settlement and Crack Monitoring
Scenario: Concrete dam shows hairline cracks at the crest. Has the dam settled? Are cracks expanding?
Drone Solution: Repeat drone inspections using identical flight path and GCP configuration every 6 months. Compare orthomosaics and DSMs. Differenced models show exact settlement location and rate. 3D measurement tools quantify crack widths and propagation rates.
Result: Data-driven structural monitoring. No guessing. Measurable trend analysis guides repairs before critical failure risk.
Use Case 3: Spillway Erosion and Maintenance Scheduling
Scenario: Spillway shows cavitation damage. How fast is it eroding? When should maintenance be scheduled?
Drone Solution: Quarterly DSM surveys. Volume differencing calculates erosion rate (cubic metres per quarter). Trend analysis predicts when critical depth will be reached. Maintenance scheduled at optimal time, not reactive, not premature.
Financial Impact: Prevents unplanned shutdowns (saving $500K–$1M per event). Consolidates maintenance into single planned campaign. ROI typically 10–30x within 2–3 years.
Use Case 4: Penstock Coating and Corrosion Assessment
Scenario: Exposed penstocks show spot corrosion. How extensive is the coating failure? What area needs repainting?
Drone Solution: High-resolution RGB imagery at close standoff (20–30m) captures coating condition across entire penstock run. Orthomosaic quantifies corrosion footprint by area. Optional multispectral imaging (5-band sensor) detects coating failure progression before visible rust appears.
Outcome: Precise repair area mapping. Competitive maintenance bids based on measurable area. No over-specification or under-specification of coating work.
Use Case 5: Intake Screen Sediment Assessment
Scenario: Trash screen at water intake accumulating sediment. When does it need cleaning? How much sediment volume?
Drone Solution: Monthly DSM surveys of intake structure and screen. Volumetric calculations show sediment accumulation rate. Predictive scheduling: clean the screen when measured volume reaches optimal threshold, not on calendar intervals.
Benefit: Optimizes plant availability by avoiding unnecessary maintenance while preventing flow losses from excessive sediment buildup.
12. Summary: Key Takeaways
- GNSS alone is inadequate: 2–5 m accuracy is too coarse for hydropower work. Always use RTK or PPK correction.
- Six inspection zones require dedicated surveys: Dam face, spillway, penstock, intake, powerhouse, and tailrace. Each has different defect signatures and sensor requirements.
- Zenatech integrated systems: RTK multirotor with 45 MP RGB camera + radiometric thermal module covers most hydropower inspection requirements from a single platform.
- Pre-flight preparation is critical: Always verify RTK FIXED status before takeoff. Fly thermal missions at dawn or dusk, not midday. Place 5–10 GCPs distributed across survey area. Coordinate with plant safety officer 2 weeks in advance.
- Standard deliverables: Orthomosaic maps, 3D digital twins, DSM/DTM elevation models, thermal anomaly maps, volumetric reports, and change detection analyses. All outputs in open geospatial formats for engineering software integration.
- Zero plant shutdown required: Properly planned drone surveys allow generation to continue. No forced downtime.
- Regulatory compliance by jurisdiction: US (FAA Part 107), Europe (EASA A2 CofC), Canada (TC RPAS Advanced). Critical infrastructure designation requires additional facility-level permits and site-specific risk assessments.
- Real-world ROI: Spillway erosion tracking eliminates reactive maintenance ($1.8M savings over 2 years). Seepage detection guides targeted repairs. Settlement monitoring prevents catastrophic failures. Measurable business impact, not theoretical benefit.
Plan Your Next Hydropower Inspection With DaaS
Drone as a Service (DaaS), a division of ZenaTech Inc., supports agencies and infrastructure operators across North America and Europe with FAA-registered equipment, certified pilot operations, and full compliance workflow support for alpine hydropower, cold-altitude, and critical infrastructure projects.