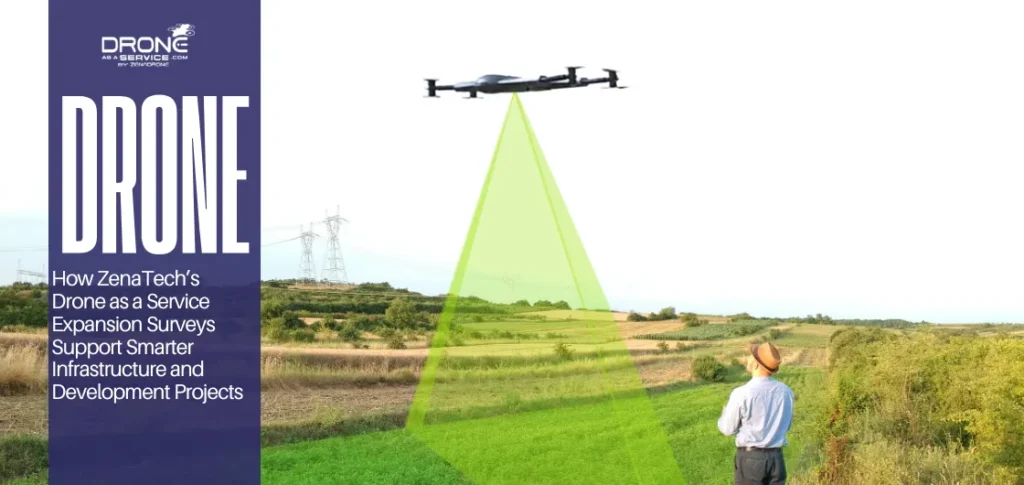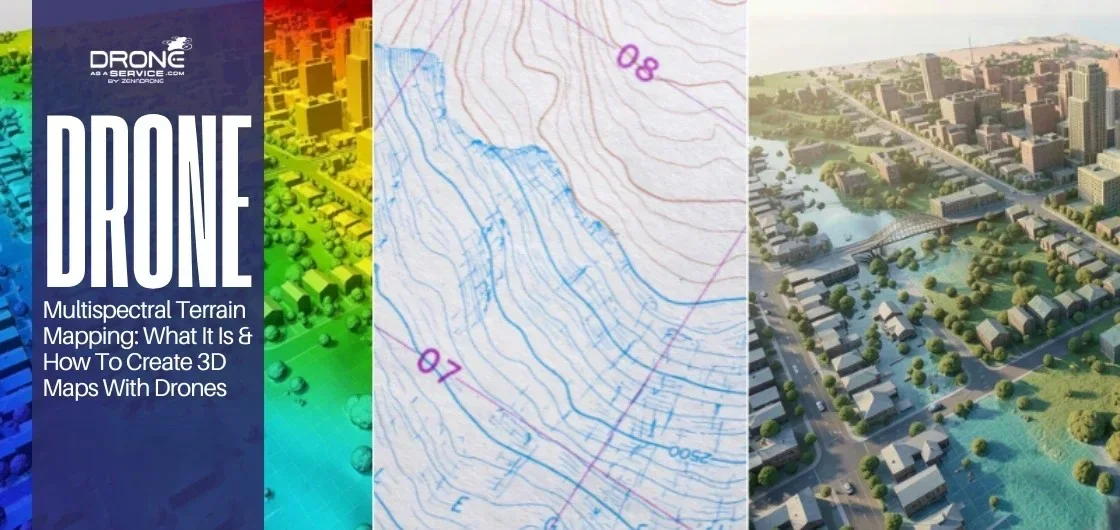
Multispectral Terrain Mapping: The Complete Expert Guide
From the ground, the hillside looked stable. The grass was green, the soil surface appeared intact, and the civil engineer standing at the base of the embankment had no particular reason for concern. It was a routine pre-construction site assessment on a linear infrastructure corridor in the mid-Atlantic US; the kind of job where you walk the boundary, take notes, and move on.
Then the multispectral survey came to the screen.
The near-infrared band revealed a distinct moisture anomaly spreading diagonally across the upper third of the slope: a subsurface water migration pattern invisible at the surface but clearly quantified in the reflectance data. Cross-referencing it against the DEM showed a subtle concavity in the terrain geometry that concentrated lateral drainage from the adjacent field system. The NDVI layer confirmed that the vegetation in that zone was physiologically stressed despite appearing green; a classic early signal of waterlogging that precedes root failure and, eventually, slope instability.
The geotechnical team changed the foundation design for that section. The project avoided what would have been a very expensive problem eighteen months into construction.
That is what multispectral terrain mapping actually does when it is applied with expertise and interpreted with the right analytical framework. It does not just produce colorful maps. It surfaces information that is invisible to every other practical survey method at field scale and it does so at a cost and speed that has fundamentally changed how engineers, agronomists, ecologists, and infrastructure planners approach early-stage site intelligence.
Want to see how this translates into real-world project delivery? Explore our multispectral services below.
This guide covers the full operational and technical picture: how multispectral terrain mapping works, why it produces data that RGB and LiDAR surveys cannot replicate, what workflows produce reliable results versus plausible-looking maps that mislead, and where the technology genuinely changes decisions across a wide range of industries and terrain types.
What is multispectral terrain mapping: The precise definition
Multispectral terrain mapping is the acquisition, georeferencing, and analysis of multi-band spectral reflectance data captured simultaneously with terrain geometry across a defined area. Sensors capture reflected light in discrete wavelength bands: typically, green (550nm), red (660nm), red-edge (735nm), and near-infrared (790nm), sometimes extended to include blue (475nm) or SWIR, while RTK GNSS and photogrammetric reconstruction georeferenced each pixel to physical coordinates. The result is a spatially accurate raster dataset where every ground position carries both geometric information and spectral signature data that classifies surface material type, vegetation condition, moisture content, and soil composition at resolutions reaching 3–8 centimeters per pixel from drone platforms. The combination of terrain geometry and spectral intelligence in a single registered dataset is what makes it categorically different from RGB photography, standalone LiDAR, or single-band thermal imaging.
Why does spectral data change decisions that RGB imagery cannot?
A standard RGB camera captures what the human eye sees; color and texture in the visible spectrum. It cannot detect chlorophyll stress that manifests in near-infrared reflectance before the leaf surface shows visible yellowing. It cannot differentiate between vegetation types with similar visual appearance but different spectral signatures. It cannot quantify soil moisture variability across a hillside based on reflectance characteristics. It cannot classify surface materials in mining environments where rock types share similar colors but diverge sharply in their near-infrared and red-edge response. Multispectral sensors capture these invisible dimensions simultaneously, enabling analytical workflows that detect, classify, quantify, and forecast conditions that RGB photography describes without explaining.
When does multispectral mapping deliver genuine ROI versus overkill?
Multispectral mapping delivers clear ROI when decisions require surface classification that visual imagery cannot support crop stress differentiation across large fields, vegetation encroachment classification in utility corridors, erosion risk assessment on engineered slopes, ecological condition monitoring across wetland and riparian zones, and mine site surface material mapping. It is overkill when the question is purely geometric: measuring volumes, documenting structural condition visually, or producing topographic surveys where reflectance classification adds no decision value. The honest answer is that most projects benefit from combining it with photogrammetric RGB or LiDAR rather than deploying it in isolation.
Key Takeaway
Spectral bands are not interchangeable: Green, red, red-edge, and near-infrared each interrogate different surface properties. Understanding which band combination answers which question is the difference between useful analysis and sophisticated-looking noise.
Radiometric calibration is not optional: Uncalibrated reflectance data produces index maps that look credible but are not comparable across time or between flight sessions. Calibration panels and irradiance sensors are operational requirements, not accessories.
NDVI is a starting point, not a conclusion: Vegetation index maps require agronomic, ecological, or geological interpretation to generate actionable intelligence. A colored NDVI map handed to a client without interpretation framework is a deliverable that looks impressive and informs nothing.
Flight timing directly affects data quality: Solar angle, atmospheric moisture, cloud shadow, and wind all degrade spectral consistency in ways that post-processing cannot fully correct. Operational discipline around flight windows is a data quality control measure.
Terrain geometry and spectral data must be co-registered: Multispectral maps without accurate DEM integration cannot support slope analysis, drainage modelling, or erosion risk correlation. The two datasets are analytically interdependent.
Seasonal timing determines what is detectable: Crop stress mapping requires flights at growth stages where stress manifests spectrally. Invasive species detection requires flights during phenological windows when the target species diverges spectrally from native vegetation. Survey timing is an analytical decision, not a scheduling convenience.
The Spectral Science Behind the Maps: Why Light Tells You What the Ground Cannot
Every surface on earth interacts with electromagnetic radiation differently. A healthy wheat canopy absorbs red light for photosynthesis and strongly reflects near-infrared wavelengths; a response driven by internal leaf cellular structure. Stressed wheat with compromised mesophyll tissue reflects red more strongly and near-infrared less intensely, producing a spectral signature shift that is measurable weeks before the plant shows visible yellowing. A patch of compacted clay absorbs near-infrared differently from sandy loam two meters away. Iron-rich mineralization in a mining exploration zone reflects SWIR wavelengths in ways that visually identical overburden does not.
These reflectance differences, called ‘spectral signatures’ are the fundamental information source that multispectral terrain mapping exploits. The sensor does not see the surface differently from the eye in terms of geometry. It sees it completely differently in terms of the physical and biological information encoded in reflected light across wavelengths the human visual system cannot access.
The Spectral Bands and What Each One Interrogates
Blue band (450–490nm): Useful for aquatic applications: water penetration depth, algae classification, and coastal habitat mapping. Highly sensitive to atmospheric scattering, which makes it the noisiest band in hazy or humid conditions and partially explains why it is excluded from agricultural multispectral sensors optimized for field conditions.
Green band (530–570nm): Correlates with chlorophyll content and canopy density. Used in vegetation indices like GNDVI that perform better than NDVI in high-biomass conditions where the NDVI signal saturates. Also useful for distinguishing vegetation types with different chlorophyll concentration profiles.
Red band (640–680nm): Chlorophyll absorption peak. Healthy vegetation absorbs red light intensively; stressed or sparse vegetation reflects it more strongly. The cornerstone of NDVI calculation and the most sensitive band to vegetation photosynthetic condition across most agricultural and ecological applications.
Red-edge band (700–740nm): The spectral transition zone between chlorophyll absorption in the red and strong cellular reflection in the near-infrared. Extremely sensitive to early-stage stress: nitrogen deficiency, early disease progression, water stress before symptoms are visible in RGB or fully established in standard NDVI. The red-edge band is the most diagnostically powerful wavelength in the modern multispectral toolkit for precision agricultural applications.
Near-infrared band (NIR, 770–900nm): Strongly reflected by healthy leaf cellular structure (mesophyll). The primary band for biomass estimation, canopy density quantification, vegetation mapping, and moisture detection. Also penetrates thin vegetation canopy to detect soil reflectance characteristics beneath, useful in sparse crop or savanna-type terrain. Combined with red in the NDVI formula, it is the workhorse of vegetation health monitoring globally.
How Spectral Signatures Enable Surface Classification
When a multispectral sensor captures reflectance values across four or five bands simultaneously at each pixel, each pixel becomes a spectral fingerprint. A GIS analyst can then train classification algorithms: supervised or unsupervised, depending on whether reference data exists to segment the orthomosaic into land cover classes based on how each pixel’s spectral profile compares to known signatures for the classes of interest.
In practice, this means that a forested hillside can be classified not just as “trees” but into species groups with different spectral characteristics: Douglas fir versus Sitka spruce versus broadleaf deciduous species, for example, each with measurably different NIR reflectance profiles. A cultivated field can be classified into yield management zones based on crop vigor variability. A mine site can be classified into overburden, waste rock, ore zones, tailings, and revegetated areas based on combined VNIR spectral response.
None of this is visible in RGB. The spectral dimensionality multiple simultaneous band measurements at each spatial position is what makes classification possible at a level of specificity that visual interpretation cannot approach.
The Spectral Contamination Problem Nobody Warns You About
Mixed pixels, where a single pixel straddles the boundary between two surface types contaminate spectral classifications in proportion to the ratio of surface types within that pixel’s ground sampling distance. At 5 cm resolution, this is generally manageable. At 30 cm resolution, a pixel covering the transition zone between bare soil and grass canopy contains a spectral signal that represents neither surface type cleanly, potentially misclassifying the pixel or reducing classification confidence. This is why resolution matters in multispectral mapping beyond just geometric accuracy. It directly affects the spectral purity of classifications.
The other contamination source is shadow. Cloud shadows that cross the survey area during flight reduce reflected irradiance in affected pixels, suppressing reflectance values across all bands and producing anomalously low vegetation index values that appear as stress zones in the output. This is one reason why experienced multispectral operators either avoid overcast days with broken cloud or specifically seek uniformly overcast conditions that eliminate discrete shadow edges entirely.
Sensor Hardware: Multispectral, LiDAR, Thermal, and the Platforms That Carry Them
There is a wide gap between the brochure specifications of multispectral sensors and their real-world performance in field conditions. Having operated several generations of sensors across agricultural, mining, and environmental projects, the distinctions that actually matter are sensor-to-sensor consistency, calibration workflow integration, irradiance correction capability, and the quality of the software ecosystem that processes the output.
Sensor Hardware: Multispectral, LiDAR, Thermal, and the Platforms That Carry Them
MicaSense RedEdge-PBands: Blue, Green, Red, Red-edge, NIR (5 bands, 10MP per band) GSD at 120m AGL: ~8 cm Calibration: DLS-2 ambient light sensor + calibration panel required Strength: Industry reference standard for agricultural and environmental multispectral work; well-validated radiometric accuracy Limitation: Requires careful calibration panel workflow; heavier than integrated alternatives |
DJI Mavic 3 MultispectralBands: Green, Red, Red-edge, NIR (4 multispectral + 1 RGB camera, 5MP per MS band) GSD at 100m AGL: ~5.2 cm Calibration: Integrated sunlight sensor with calibration panel for absolute reflectance Strength: Integrated RGB + multispectral in a compact platform; excellent for agricultural surveys up to ~200 hectares per flight Limitation: 5MP multispectral resolution limits fine-feature classification compared to 10MP alternatives |
senseFly eBee X with Parrot Sequoia+Bands: Green, Red, Red-edge, NIR (1.2MP per band) Coverage: 220+ hectares per flight at 120m AGL Strength: Extended range makes large-area agricultural surveys economically viable; fixed-wing stability improves spectral consistency in moderate wind conditions Limitation: Lower resolution limits fine-feature analysis; requires open launch/recovery area |
DJI Matrice 350 RTK + MicaSense RedEdge-MXBands: Blue, Green, Red, Red-edge, NIR (1.2MP per band) Strength: Heavy-lift platform enables simultaneous thermal + multispectral payload for combined vegetation and thermal stress mapping RTK accuracy: ±2 cm horizontal with RTK fix Limitation: Higher operational complexity; requires experienced operators for multi-payload configuration |
While sensor selection determines the quality of spectral data collected, the drone platform carrying those sensors plays an equally important role in flight endurance, stability, payload flexibility, and mission automation. Enterprise platforms such as the ZenaDrone 1000 are designed to support multispectral, thermal, and LiDAR payloads, enabling organizations to deploy a single aircraft architecture across multiple inspection, mapping, and monitoring workflows.
When to Add LiDAR or Thermal to a Multispectral Survey
Multispectral mapping classifies surface condition but cannot penetrate canopy to characterize ground terrain beneath dense vegetation. LiDAR does exactly that emitting laser pulses that return from multiple heights within a canopy layer, generating a point cloud that reconstructs both the canopy surface and the ground beneath it simultaneously.
For terrain mapping in forested or scrubland environments where the goal is understanding what lies beneath the vegetation as well as the vegetation itself, integrating LiDAR point cloud data with multispectral reflectance data creates a combined dataset of extraordinary analytical depth.
Thermal imaging adds a third dimension: surface temperature, that correlates with soil moisture, plant water stress, irrigation system performance, and subsurface thermal anomalies. The combination of multispectral vegetation indices with co-registered thermal data enables differentiation between crop stress caused by pest damage (which appears spectrally but not thermally) and stress caused by water deficit (which appears in both spectral and thermal signatures). That distinction changes the management intervention entirely.
Sensor Selection Decision Framework
Multispectral only: Vegetation health monitoring, crop stress mapping, land cover classification, basic erosion and vegetation encroachment assessment. Sufficient for 70–80% of agricultural and environmental monitoring applications.
Multispectral + LiDAR: Forested terrain mapping, infrastructure corridor analysis with vegetation, terrain reconstruction under canopy, detailed slope and drainage analysis where surface photogrammetry is insufficient.
Multispectral + Thermal: Irrigation system efficiency audits, plant water stress differentiation, building envelope moisture mapping combined with vegetation health assessment, early disease detection in high-value crops.
Multispectral + LiDAR + Thermal: Complex environmental assessments, mining site characterization, large infrastructure corridor planning, the full suite that warrants heavy-lift industrial platforms and experienced multi-payload operations.
The Complete Field Workflow: From Mission Planning to Calibration Panel
I have seen multispectral surveys that were technically executed well: good platform, proper sensor, correct altitude produce data that was analytically worthless because the field workflow surrounding the flight was not designed for spectral data quality. Calibration was skipped because the light “looked consistent.” Ground control points were GPS-located rather than RTK-surveyed. The flight started at 11am when solar angle was already creating NIR hotspot effects across south-facing slopes. The client got a colourful map that could not be compared to anything, correlated with anything, or used to make a decision.
The workflow is not a formality. It is the data quality control system.
|
1
|
Mission Planning: Altitude, Overlap, and Flight DirectionMission altitude determines ground sampling distance and coverage area per battery. For most agricultural multispectral surveys, 80–120m AGL balances resolution (5–8 cm GSD) against practical coverage per flight. Forward overlap of 80–85% and side overlap of 70–75% are minimum requirements for reliable photogrammetric reconstruction, reducing these to save flight time creates orthomosaic stitching artefacts and data gaps that are particularly damaging in multispectral outputs where spectral consistency across the mosaic boundary is critical. Flight direction should be aligned with the sun azimuth where possible to minimize differential illumination across the mosaic. |
|
2
|
Calibration Panel Capture: Before and After Every FlightThe calibration panel is a panel of known reflectance values, typically four grey-scale targets from ~5% to ~95% reflectance photographed under ambient light conditions before takeoff and immediately after landing. These captures allow processing software to convert raw digital numbers from the sensor into absolute reflectance values that are independent of the specific illumination conditions during the flight. Without this conversion, you have relative brightness data, not reflectance data and relative brightness is not comparable across flight sessions, flight dates, or sensor units. If your provider does not capture calibration panel images before and after each flight, their vegetation index maps cannot be used for time-series comparison. |
|
3
|
Ground Control Points: RTK Surveyed, Not GPS EstimatedGround control points for multispectral terrain mapping should be RTK-surveyed to ±2–3 cm positional accuracy. Standard GPS GCPs at ±1–3-meter accuracy introduce georeferencing error that affects the co-registration of multispectral data with terrain models, previous survey datasets, and GIS infrastructure layers. GCPs should be distributed across the full site area not clustered at the center and should include check points that are not used in the georeferencing calculation but are used to validate it. Five to seven GCPs for a 120-acre site is a reasonable baseline; large or topographically complex sites require more. |
|
4
|
Flight Window Selection: Why Dawn Is Not Just PreferenceThe optimal spectral quality window in mid-latitudes runs from approximately two hours after sunrise until solar noon, with the best consistency in the first half of this window. After solar noon, solar angle creates differential illumination on east and west-facing slopes that is difficult to correct radiometrically. Early morning flights in agricultural applications also benefit from lower wind speeds, important because even modest wind causes plant movement between exposures in adjacent spectral bands, creating misregistration between bands that appears as spectral noise in vegetation index calculations. Dawn flights in hot climates also capture crop water status before midday heat stress alters stomatal behavior and modifies the thermal expression of water deficit independently of actual soil water availability. |
|
5
|
PPK vs RTK in the Field: When Each Makes SenseRTK (Real-Time Kinematics) corrects GNSS position in real time during flight, requiring a live data link to a base station or network CORS. It delivers immediate positional confidence but is vulnerable to link interruption in terrain with radio shadow or at extended base-to-rover distances. PPK (Post-Processed Kinematics) records raw GNSS observations during flight and applies base station correction data after landing, more robust in radio-challenged terrain, delivers equivalent accuracy, but requires that the base station has recorded continuously throughout the flight. In practice, PPK is the more reliable choice for remote terrain surveys where base station radio coverage cannot be guaranteed; RTK is preferred for urban and periurban sites where network CORS availability is consistent. |
Data Privacy, PII Handling, and U.S. Compliance Workflows
High-resolution and multispectral sensors often capture public roads, adjacent private property, vehicles, and site personnel beyond the immediate project area. In U.S. operations, imagery containing personally identifiable information (PII) such as human faces, license plates, and other identifiable details should be treated as sensitive data under client privacy policies, state-level privacy requirements, and internal compliance standards.
Best-practice protocol: Before orthomosaic generation, analytics sharing, or client reporting, raw imagery should be reviewed and redacted where appropriate using controlled access, retention limits, and documented handling procedures. For projects in populated areas or near public infrastructure, operators should complete a documented privacy review and define a clear data-handling workflow before deployment.
Airspace Authorizations & Commercial Liability Insurance
Mapping industrial areas, transport corridors, or municipal perimeters typically requires operating near restricted or controlled airspaces. In the United States, commercial drone operators must secure the appropriate airspace authorizations through the FAA; either via LAANC (Low Altitude Authorization and Notification Capability) for automated approvals in controlled airspace, or through a formal FAA Part 107 waiver for operations that fall outside standard rule parameters such as night flights, operations over people, or BVLOS missions.
Liability Requirement: Operating commercial remote sensing assets without specific commercial drone liability insurance with an industry-standard minimum coverage floor of $1M to $5M per occurrence, introduces critical financial and legal risk. Policies must explicitly cover spatial data collection operations, third-party property damage, and privacy liability claims arising from aerial imagery capture.
Data Processing: Orthomosaics, Vegetation Indices, and Terrain Reconstruction
The processing pipeline for multispectral terrain mapping is more complex than RGB photogrammetry, and the decisions made at each stage propagate through to the accuracy and interpretability of the final outputs. Understanding what the software is doing and where the assumptions embedded in automated workflows can produce errors, is essential for anyone commissioning or interpreting these datasets.
The Processing Sequence
Step 1: Radiometric calibration: Processing software (Pix4D Mapper, Agisoft Metashape, DroneDeploy) applies calibration panel reflectance values to convert raw sensor digital numbers into calibrated reflectance. The DLS-2 irradiance sensor on MicaSense platforms records ambient light throughout the flight, enabling time-stamped irradiance correction at each image capture; critical for long flights where lighting conditions change.
Step 2: Band alignment: Multispectral cameras with separate imaging sensors for each band capture images with slight spatial offsets, the sensors are physically positioned at different locations on the camera body. Band alignment corrects this offset so each band’s image registers to the same ground coordinates. Misaligned bands produce vegetation index maps with characteristic fringing artefacts at field boundaries that indicate the alignment correction failed or was not applied.
Step 3: Photogrammetric reconstruction: Structure from Motion algorithms identify tie points across overlapping images, reconstruct camera positions, and generate a dense point cloud and orthomosaic. For multispectral data, this is performed on the red band as the primary reference band (highest contrast vegetation-soil differentiation) before applying the transformation to remaining bands.
Step 4: DEM generation: The digital elevation model is extracted from the dense point cloud, interpolated across data gaps, and validated against GCP check points. For terrain analysis applications, the DSM (including vegetation surface) and DTM (bare earth after vegetation filtering) are generated separately. The distinction between them is where analytical errors most commonly originate when operators confuse the two.
Step 5: Index calculation and raster analysis: Vegetation indices (NDVI, NDRE, SAVI, EVI, GNDVI) are calculated as per-pixel band arithmetic on the calibrated reflectance orthomosaic. GIS raster analysis then overlays these indices with terrain derivatives: slope, aspect, curvature, flow accumulation to identify spatial correlations between terrain characteristics and vegetation condition.
The Software Ecosystem and Its Trade-offs
Pix4Dfields processes agricultural multispectral workflows faster than general photogrammetry platforms because it incorporates vegetation-specific processing assumptions: flat terrain simplification, pre-configured index calculations, and agronomic output formats. It trades flexibility for speed: it performs poorly on complex terrain and does not support the GCP-intensive accuracy workflows required for engineering or environmental applications where geometric precision matters beyond agronomic zone delineation.
Agisoft Metashape offers more control over the photogrammetric reconstruction process: point cloud filtering, mesh generation parameters, coordinate system transformation at the cost of a steeper learning curve and longer processing times on large datasets. For terrain mapping applications where DEM accuracy and GIS integration with existing datasets is the priority, Metashape is the more appropriate tool.
ArcGIS and QGIS are where multispectral outputs are typically analysed rather than generated spatial correlation, multi-layer overlay, change detection between survey epochs, zonal statistics extraction, and integration with infrastructure and cadastral datasets. The handoff from processing software to GIS is where the analytical value of multispectral terrain mapping is most commonly either realised fully or wasted through inadequate raster analysis workflow.
Vegetation Intelligence: NDVI, NDRE, SAVI, and What They Actually Tell You
NDVI is the most widely used vegetation index globally and the most widely misinterpreted. It is a ratio: (NIR – Red) / (NIR + Red). It correlates with photosynthetic activity and canopy density. What it does not do, by itself, is tell you why a low NDVI value is low. A field section with NDVI 0.3 might have low plant biomass because the crop is sparse, because it is water stressed, because it has a nutrient deficiency, because a pest is attacking the root system, or because the soil in that zone is compacted and restricts root development. NDVI identifies spatial variability in vegetation condition; it does not diagnose cause.
| Index | Formula | Primary Use | Limitation |
|---|---|---|---|
| NDVI | (NIR-Red)/(NIR+Red) | General vegetation health, canopy density, biomass estimation | Saturates at high biomass (NDVI >0.8); soil background interference in sparse vegetation |
| NDRE | (NIR-RedEdge)/(NIR+RedEdge) | Early stress detection, nitrogen status, chlorophyll content at early deficiency stages | Requires red-edge band; less validated across crop types than NDVI |
| SAVI | ((NIR-Red)/(NIR+Red+L)) × (1+L) | Sparse vegetation mapping where soil reflectance contaminates NDVI; arid terrain, early crop stages | L factor requires soil background knowledge to set correctly |
| GNDVI | (NIR-Green)/(NIR+Green) | High-biomass crops where NDVI saturates; chlorophyll content in dense canopies | Less sensitive than NDRE to early-stage stress |
| EVI | 2.5 × (NIR-Red)/(NIR+6×Red-7.5×Blue+1) | Atmospheric correction, high-biomass environments, tropical forest canopy assessment | Requires blue band; more sensitive to atmospheric correction quality than NDVI |
The Hidden Causes of Inaccurate Vegetation Index Maps
Wet terrain surface reflectance: Soil moisture dramatically reduces surface reflectance in the NIR band: wet soil absorbs near-infrared rather than reflecting it, which can produce artificially low NIR values that suppress vegetation index calculations even in healthy vegetation growing on saturated ground. Surveys conducted within 24–48 hours of significant rainfall introduce this artefact. The effect is particularly pronounced in bare soil areas adjacent to vegetated zones, where wet soil patches can be misclassified as stressed vegetation.
Wind-induced plant movement between band captures: Multispectral cameras with separate sensors capture each band in rapid sequence but not simultaneously. Even at 1/1000 second intervals, wind-induced plant movement between the red and NIR captures creates spatial misregistration that appears as spectral noise in the calculated index. High-frequency wind gusts during the survey are more damaging than steady wind of equivalent average speed, because steady wind produces consistent displacement while gusts create variable, uncorrectable offsets.
Edge distortion at field boundaries: Photogrammetric stitching introduces geometric distortion at orthomosaic edges that is typically 2–5% of the field extent. In vegetation index maps, this translates to anomalous index values along field edges that are processing artefacts rather than real vegetation condition signals. The solution is to overlap flight coverage 10–15% beyond the area of interest and clip the delivered orthomosaic to the actual field boundary, discarding the distorted periphery.
Crop phenology misalignment: NDVI values change significantly across the crop growth cycle independently of stress condition; a field at canopy closure reads very differently from the same field two weeks earlier at 50% coverage. Time-series comparison of vegetation index maps is only meaningful when surveys are conducted at equivalent phenological stages across comparison dates, not just equivalent calendar dates, which vary by up to three weeks across a typical growing season depending on temperature accumulation.
Terrain Intelligence: Erosion Detection, Drainage Analysis, Slope Mapping, and Moisture Migration
Multispectral mapping’s terrain intelligence value comes not from vegetation indices alone but from the analytical intersection of spectral data with terrain geometry. When you overlay an NDVI map on a slope aspect raster, you can identify whether vegetation stress is spatially correlated with terrain exposure; a pattern that implies moisture or temperature-driven stress rather than uniform pest pressure. When you correlate vegetation density with flow accumulation paths from a DTM, you can identify drainage corridors that concentrate moisture in ways that explain both the vegetation vigor anomalies in those zones and the erosion patterns developing at their downslope terminations.
Erosion Monitoring and Early Detection
Erosion progresses through stages that produce distinct spectral signatures before they produce geometrically measurable topographic change. Rill initiation exposes subsoil with different mineralogy and moisture content from the surrounding topsoil, producing a detectable NIR reflectance anomaly at the surface. Sheet erosion reduces organic matter content across slope areas, which systematically shifts soil reflectance in ways that correlate with NDVI decline in adjacent vegetation, stressed roots in degraded soil produce reduced canopy photosynthetic activity measurable weeks before the visual surface shows bare soil exposure.
Detecting this chain: reflectance anomaly → vegetation stress correlation → slope position and aspect analysis → flow path convergence, enables erosion risk forecasting rather than erosion documentation. The distinction matters enormously in infrastructure settings, where slope failure after erosion progresses is expensive and occasionally catastrophic, versus early slope stabilization intervention which is routine and inexpensive.
Floodplain and Drainage Analysis
Multispectral floodplain mapping combines water surface detection from blue band absorption signatures with vegetation classification that identifies riparian zone extent, wetland boundary delineation, and soil saturation patterns in adjacent agricultural or developed land. Post-flood event surveys using time-series comparison detect inundation extent by identifying areas where the NIR reflectance has shifted from vegetation-normal to water-absorption levels between pre- and post-event survey dates.
For infrastructure planning, this is directly applicable to pipeline route analysis, where identifying drainage crossings and floodplain encroachment early in route selection avoids costly realignment later. Renewable energy planning for solar farm siting uses multispectral floodplain classification to identify areas where waterlogging risk disqualifies ground-mounted panel installation. Utility corridor vegetation management programmes use drainage analysis to forecast growth zones where vegetation encroachment will accelerate under high soil moisture conditions.
Seasonal Terrain Variability and Survey Timing
Terrain classification from multispectral data is not seasonally stable. The same surface produces different spectral signatures in different seasons, which means survey timing is an analytical decision that must align with the surface condition being characterized. A wetland boundary survey conducted in August when vegetation is at peak density produces a different classification than the same survey in March when deciduous riparian vegetation is leafless and the spatial extent of the hydric soil zone is more clearly readable in the reflectance data.
For mining site characterization, seasonal timing affects the spectral differentiation between vegetated and unvegetated surfaces and the moisture content of tailings ponds, which modifies their NIR reflectance signature. For archaeological mapping, the optimal timing is typically early spring before vegetation growth obscures surface anomalies produced by subsurface features, buried structures and features create soil moisture and organic matter patterns that produce faint but detectable NDVI differences in the thin grass cover above them.
Accuracy, Calibration, and the Sources of Error Nobody Warns You About
Multispectral mapping has two accuracy dimensions that must be addressed independently: Geometric Accuracy: How precisely each pixel is located in physical space and Radiometric Accuracy: How precisely each pixel’s reflectance values represent actual surface reflectance rather than sensor artefacts, illumination variation, or calibration error. Most quality discussions focus on geometric accuracy because it is easier to measure and communicate. Radiometric accuracy is equally important and considerably harder to validate after the fact.
Geometric Accuracy: Realistic Expectations
With RTK GNSS and five or more well-distributed ground control points, multispectral drone surveys consistently achieve horizontal accuracy of ±2–5 cm and vertical accuracy of ±3–8 cm, validated against independent check points. This is the accuracy range required for most agricultural, environmental, and construction monitoring applications.
For formal engineering submissions: slope stability analysis, volumetric calculations for payment certification, planning authority submissions, the accuracy expectation should be validated by a licensed surveyor who has checked the drone-derived terrain model against ground-truth measurements. Drone survey accuracy is stated as a statistical distribution, not a guarantee at every point: local anomalies from poor texture, water surfaces, or shadow can produce point-specific errors that exceed the stated average accuracy.
GPS drift challenges, where GNSS positional lock shifts gradually during a long flight session due to satellite geometry changes are mitigated by PPK processing, which retrospectively applies a consistent correction across all image positions rather than relying on real-time lock quality.
Radiometric Accuracy: The Less-Discussed Challenge
Vignetting correction: Multispectral camera lenses produce uneven illumination across the image: brighter at center, darker at edges, due to the optics. Vignetting correction coefficients are applied in processing to normalize this. Poor vignetting correction produces orthomosaics where stitching seams are visible as tonal differences in the index map, particularly in bare soil areas with low spatial variability that would otherwise mask them.
Atmospheric absorption: Water vapor in the atmosphere absorbs NIR wavelengths differentially depending on atmospheric path length which changes with solar angle across a long survey. This creates slight gradient effects across large orthomosaics acquired over two-to-three-hour windows where the atmospheric correction applied uses a single irradiance measurement rather than time-stamped continuous monitoring.
Terrain occlusion problems: Steep terrain creates areas of image shadow where one slope face is illuminated, and the adjacent slope face is in shadow. Shadow areas produce anomalously low reflectance values that cannot be corrected from the data alone without topographic shadow modelling: a workflow that requires co-registered DEM data and is not performed by most standard processing pipelines.
Key Comparisons: What to Use When and Why
Multispectral vs. RGB Mapping
| Factor | RGB Mapping | Multispectral Mapping |
|---|---|---|
| Surface classification | Visual color and texture only | Spectral signature classification across 4–5 bands including non-visible wavelengths |
| Vegetation health detection | Detects advanced yellowing and visible symptoms only | Detects stress 2–4 weeks before visible symptoms via NIR and red-edge response |
| Cost | Lower sensor cost; widely available | Higher sensor cost; specialist workflow required |
| Best application | Visual documentation, photogrammetric survey, structural inspection, progress monitoring | Crop stress mapping, ecological classification, erosion risk assessment, land cover analysis |
| Recommendation | Most terrain mapping projects benefit from both. RGB provides the geometric reference and visual interpretability; multispectral provides the spectral intelligence. Deploying them simultaneously on one platform as the DJI Mavic 3 Multispectral does, is the most efficient approach. | |
Drone Multispectral vs. Satellite Multispectral
| Factor | Satellite (Sentinel-2, Planet) | UAV Multispectral |
|---|---|---|
| Spatial resolution | 3–10 m/pixel | 3–10 cm/pixel – 100–300× finer |
| Temporal frequency | 3–5 days (cloud dependent) | On-demand; same day in most conditions |
| Coverage area | Continental/global – unlimited | 50–500 ha per day depending on platform |
| Cost | Low to free (Sentinel-2) to ~$2/km² (Planet) | $500–$5,000 per survey depending on scale |
| Best application | Landscape-scale monitoring, regional change detection, large agricultural holdings | Field-scale precision decisions, individual plant stress detection, engineering-grade terrain analysis |
Industry Applications: Where Multispectral Terrain Mapping Changes Decisions
Precision Agriculture
This is where multispectral drone mapping first demonstrated commercial scale, and it remains the highest-volume application globally. The workflow is well-established: multispectral survey at key crop growth stages, NDVI and NDRE index generation, zone delineation for variable-rate application prescriptions, and agronomic interpretation by a specialist who understands the crop physiology behind the spectral signal.
The most practically valuable agricultural application is not uniform whole-field monitoring but targeted problem diagnosis. A section of a field showing consistently low NDRE values across three survey dates in a season is telling you something structural: compaction, drainage, pH anomaly, rather than something manageable with a single foliar spray. That diagnostic information, interpreted correctly, changes the agronomist’s recommendation from a repeat input application to a soil investigation that addresses the root cause.
Mining and Resource Exploration
Mine sites are among the most analytically demanding environments for multispectral mapping and among the most valuable. The applications span the full mine lifecycle: exploration surveys using VNIR spectral response to classify surface mineralogy and identify alteration zones associated with economic mineralization; operational surveys to monitor tailings pond desiccation, classify waste rock dumps by material type, and assess vegetation establishment on rehabilitated areas; and closure surveys to document progressive revegetation against regulatory targets.
Tailings monitoring is a particularly critical application. Acid mine drainage: the leaching of sulphide minerals from tailings into adjacent drainage networks produces characteristic vegetation stress signatures in the buffer zones surrounding tailings storage facilities. Multispectral monitoring at monthly intervals detects the leading edge of phytotoxicity expansion that indicates acid drainage is mobilizing from the tailings containment, typically three to six months before it would be detected by downstream water quality monitoring. That lead time is the difference between a containment repair and a regulatory enforcement action.
Forestry and Ecological Assessment
Commercial forestry operations use multispectral mapping for canopy health assessment, stress detection from bark beetle activity or fungal disease, species composition mapping in mixed-species plantations, and post-harvest regeneration monitoring. The red-edge band is particularly valuable here, conifer stress from bark beetle attack produces a characteristic red-edge shift before photosynthesis declines sufficiently to suppress NDVI, giving forest managers a two-to-three-week lead time over traditional visual patrol methods to identify and remove affected trees before secondary beetle emergence.
Invasive species mapping in ecological restoration projects exploits phenological differences between target invasive species and native vegetation. Japanese knotweed in early spring growth, for example, shows an NIR reflectance profile that differs measurably from adjacent native shrub species during the two-week window when knotweed is breaking dormancy and native species have not yet flushed. Surveys timed to this phenological window can classify knotweed patches at accuracies exceeding 90% that would not be achievable at other times of year when spectral separation between species is insufficient.
Infrastructure Planning and Utility Corridor Management
For utility corridor vegetation management: the ongoing programme of maintaining vegetation clearances under and adjacent to transmission lines: multispectral mapping automates what was previously a helicopter or ground patrol activity. LiDAR quantifies canopy height and clearance distance from conductors with centimeter precision. Multispectral classification identifies fast-growing species with high encroachment risk versus slow-growing species that can be managed on longer cycles. The combined output prioritizes vegetation management crews by risk rather than by geographic sequence, reducing total management cost while improving clearance compliance.
Pipeline route analysis uses terrain multispectral data to classify soils, identify wetland and floodplain features, map steep slope zones requiring reinforced installation design, and document baseline ecological conditions before ground disturbance, establishing the reference dataset against which post-construction revegetation compliance is measured.
Environmental Monitoring and Disaster Management
Post-flood multispectral surveys map inundation extent by detecting the NIR absorption signature of standing water, identify areas of sediment deposition from the reflectance signature of disturbed soil, and assess vegetation damage extent by comparing pre- and post-event NDVI values. This dataset supports damage assessment for insurance and emergency management purposes, flood modelling validation, and infrastructure vulnerability mapping for future flood risk management.
Wildfire assessment surveys use the Normalized Burn Ratio (NBR): a multispectral index derived from NIR and SWIR bands to classify fire severity across burned areas, distinguishing high-severity canopy loss from lower-severity surface burns where recovery is faster. This classification informs post-fire erosion risk assessment, since high-severity burned slopes lose the root network that resists erosion and are at highest risk during the first post-fire rain season.
GIS Integration, Digital Twins, and Geospatial Analytics
The processing pipeline outputs: calibrated reflectance orthomosaic, vegetation index rasters, and DEM/DSM/DTM layers become analytically powerful only when integrated into a GIS environment where they can be correlated with other spatial datasets, queried spatially, and interpreted in the context of the wider landscape and infrastructure.
In ArcGIS or QGIS, the multispectral raster stack becomes one layer in a multi-source spatial analysis framework. The NDVI raster is overlaid with soil classification polygons to identify whether vegetation stress correlates with specific soil types. The drainage accumulation raster derived from the DTM is correlated with low NDVI zones to identify whether poor drainage explains vegetation stress spatial patterns. Change detection between survey epochs quantifies erosion extent, revegetation establishment, or crop vigor variability trends across seasons.
Digital Twin Integration for Construction and Infrastructure
In construction and infrastructure applications, multispectral terrain data integrates into digital twin platforms by providing the ecological and surface condition layer that complements geometric BIM data. A construction site digital twin that incorporates periodic multispectral surveys captures not just structural progress but surface condition dynamics, erosion development on earthworks slopes, revegetation establishment in mitigation zones, drainage performance across the graded site surface in a temporally indexed spatial record that supports both operational management and regulatory compliance reporting.
SCADA system integration in large infrastructure operations enables correlation of geospatial multispectral outputs with operational sensor data: soil moisture sensors, groundwater level loggers, precipitation records, creating a combined dataset that develops predictive models for surface condition dynamics rather than simply recording them.
Regulatory Compliance: FAA Part 107, EASA, BVLOS, and the Practical Implications
Commercial multispectral drone surveys are commercial UAV operations in every jurisdiction: regulated activities that require specific operator certification, operational authorizations, and compliance documentation. The technical sophistication of the sensor does not modify the regulatory requirement; it applies equally to a basic RGB survey and to a multi-sensor LiDAR-multispectral campaign.
| Jurisdiction | Framework | Commercial Certification | BVLOS Status |
|---|---|---|---|
| United States | FAA Part 107 | Remote Pilot Certificate; knowledge test + recurrent 24-month requirement | FAA waiver required; expanding under BEYOND program |
| European Union / Ireland | EASA Regulation 2019/947 + national authority implementation | Open/Specific/Certified category; Specific Category requires Operational Authorization | National authority BVLOS waiver; framework expanding 2025–2026 |
| United Kingdom | CAA ANO + OSC | GVC (General Visual Line of Sight Certificate) for most commercial work | CAA Operational Safety Case required |
| Australia | CASA Part 101 | Remote Pilot Licence (RePL) for drones over 2kg; ReOC for commercial operations | CASA approval; active development programme |
| Canada | Transport Canada CARs Part IX (RPAS rules) | Pilot Certificate – Basic or Advanced Operations; Advanced operations require a flight review and are needed for controlled airspace or near-people scenarios | Special Flight Operations Certificate (SFOC) typically required; case-by-case approval under Transport Canada, with the BVLOS framework continuing to evolve |
BVLOS for Large-Area Multispectral Surveys: The Regulatory Reality
For large-area multispectral terrain mapping: mining leases of several hundred hectares, agricultural properties exceeding 500 hectares, linear infrastructure corridors extending over several kilometers. VLOS operations require so many ground repositioning events that they become economically uncompetitive with satellite imagery alternatives. BVLOS operations enable continuous corridor coverage and large-area surveys at coverage rates approaching fixed-wing aircraft economics. The regulatory path to BVLOS authorization is more demanding, requiring documented safety cases, detect-and-avoid capability or ground observer networks, and in some jurisdictions, specific platform certification but for commercial operators conducting large-area multispectral campaigns routinely, the operational efficiency gain justifies the authorization investment.
AI Integration, Automation, and Where Multispectral Mapping Is Actually Heading
The most significant change in multispectral terrain mapping over the next three to five years will not be sensor technology, that is evolving incrementally toward higher resolution and more bands at lower weight. The significant change will be the integration of AI-driven classification and anomaly detection that converts spectral data into structured intelligence without the bottleneck of expert analyst time for every dataset.
Current AI applications in multispectral processing are already moving from research to operational deployment in commercial platforms. Machine learning models trained on annotated spectral datasets classify land cover, detect stress patterns, identify disease signatures, and segment vegetation types at speeds that manual analyst workflows cannot approach. The critical limitation and it is a real one that practitioners in the field will confirm, is that these models require training data that represents the specific spectral conditions of the target environment, sensor model, and phenological stage. A model trained on Californian irrigated corn does not transfer directly to Irish spring barley, and deploying it without validation produces confidently wrong classifications.
Developments Worth Watching in 2026–2030
Hyperspectral democratisation: As hyperspectral sensor weight and cost continue to decline, the boundary between multispectral and hyperspectral operational platforms is eroding. DJI’s Zenmuse P1 and emerging competitors are pushing pixel resolution upward while sensor miniaturisation enables more bands at equivalent weight. Within five years, 20–30 band hyperspectral sensors at multispectral prices are a realistic commercial prospect.
Edge computing on platform: Processing vegetation indices and basic classifications onboard the drone during flight, rather than in post-processing, enables real-time delivery of preliminary analysis to ground operators and farm management systems. This compresses the sensor-to-decision timeline from days to minutes for routine monitoring applications.
Automated flight-to-decision pipelines: Integration between drone flight management platforms (DroneDeploy, Pix4D) and farm management information systems is enabling automated survey scheduling, processing, and variable-rate application prescription generation without manual analyst intervention in routine monitoring cycles.
Persistent monitoring swarms: Multi-drone swarm operations under unified mission planning are emerging as the operational model for very large area monitoring: mining operations, large agricultural landholdings, watershed scale environmental monitoring. A coordinated swarm of four to six fixed-wing BVLOS platforms can survey 2,000+ hectares in a single morning flight window, something that no single-platform workflow can achieve at comparable spectral resolution.
Operational scale and project budgeting vary widely based on regional acreage, sensor configurations, and specific data asset requirements:
- Agricultural & Vegetation Analytics: Focuses on optimized indexing like NDVI/NDRE alongside baseline radiometric calibration, which may help optimize yield mapping and support localized crop management strategies.
- Integrated LiDAR & Spectral Pipelines: Combining data layers offers potential applications for complex topographical sites, where dual-payload alignments can significantly enhance surface model precision.
- Enterprise Mine, Utility & Critical Infrastructure Operations: Scaling to high-density GCP setups and specialized FAA asset tracking frameworks can support complex spectral classification and align with long-term engineering validation workflows.
The key commercial drivers typically include localized airspace coordination, specialized sensor density, data processing depth, and the exact spatial accuracy boundaries required by project stakeholders.
Multispectral Terrain Mapping Requires Expertise at Every Stage
The sensor is the beginning, not the solution. The workflows that produce reliable, interpretable, and actionable multispectral terrain datasets require disciplined calibration procedures, appropriate flight timing and conditions, accurate georeferencing, validated processing pipelines, and domain-specific analytical interpretation. Every stage where shortcuts are taken produces data that looks impressive and informs poorly.
Operators who can explain what they do at each stage of this pipeline and why are the ones whose outputs can be trusted to change a real decision. That is the standard against which multispectral terrain mapping providers should be evaluated.